

Case study: Trilogy
How Trilogy defined and measured their magic to find scalable product-market fit.

Ahmed Haque, former Chief Academic Officer at Trilogy Education provided a great case study on how to measure product-market fit. Find out how Trilogy defined their magic, measured it, and built a culture of responsiveness as they scaled from 0 to $100m revenue in 4 years.
“They hated our program, they hated the curriculum, they weren’t showing signs of learning, they were asking for refunds… They were sending letters. Depressing letters. Threatening letters,” remembers Ahmed. “Students were beyond angry.”
He is describing the moment when Trilogy Education scaled from one bootcamp to two. His students were happy, they were showing signs of incredible progress. And even those students with little to no background in technology were making leaps in their careers.
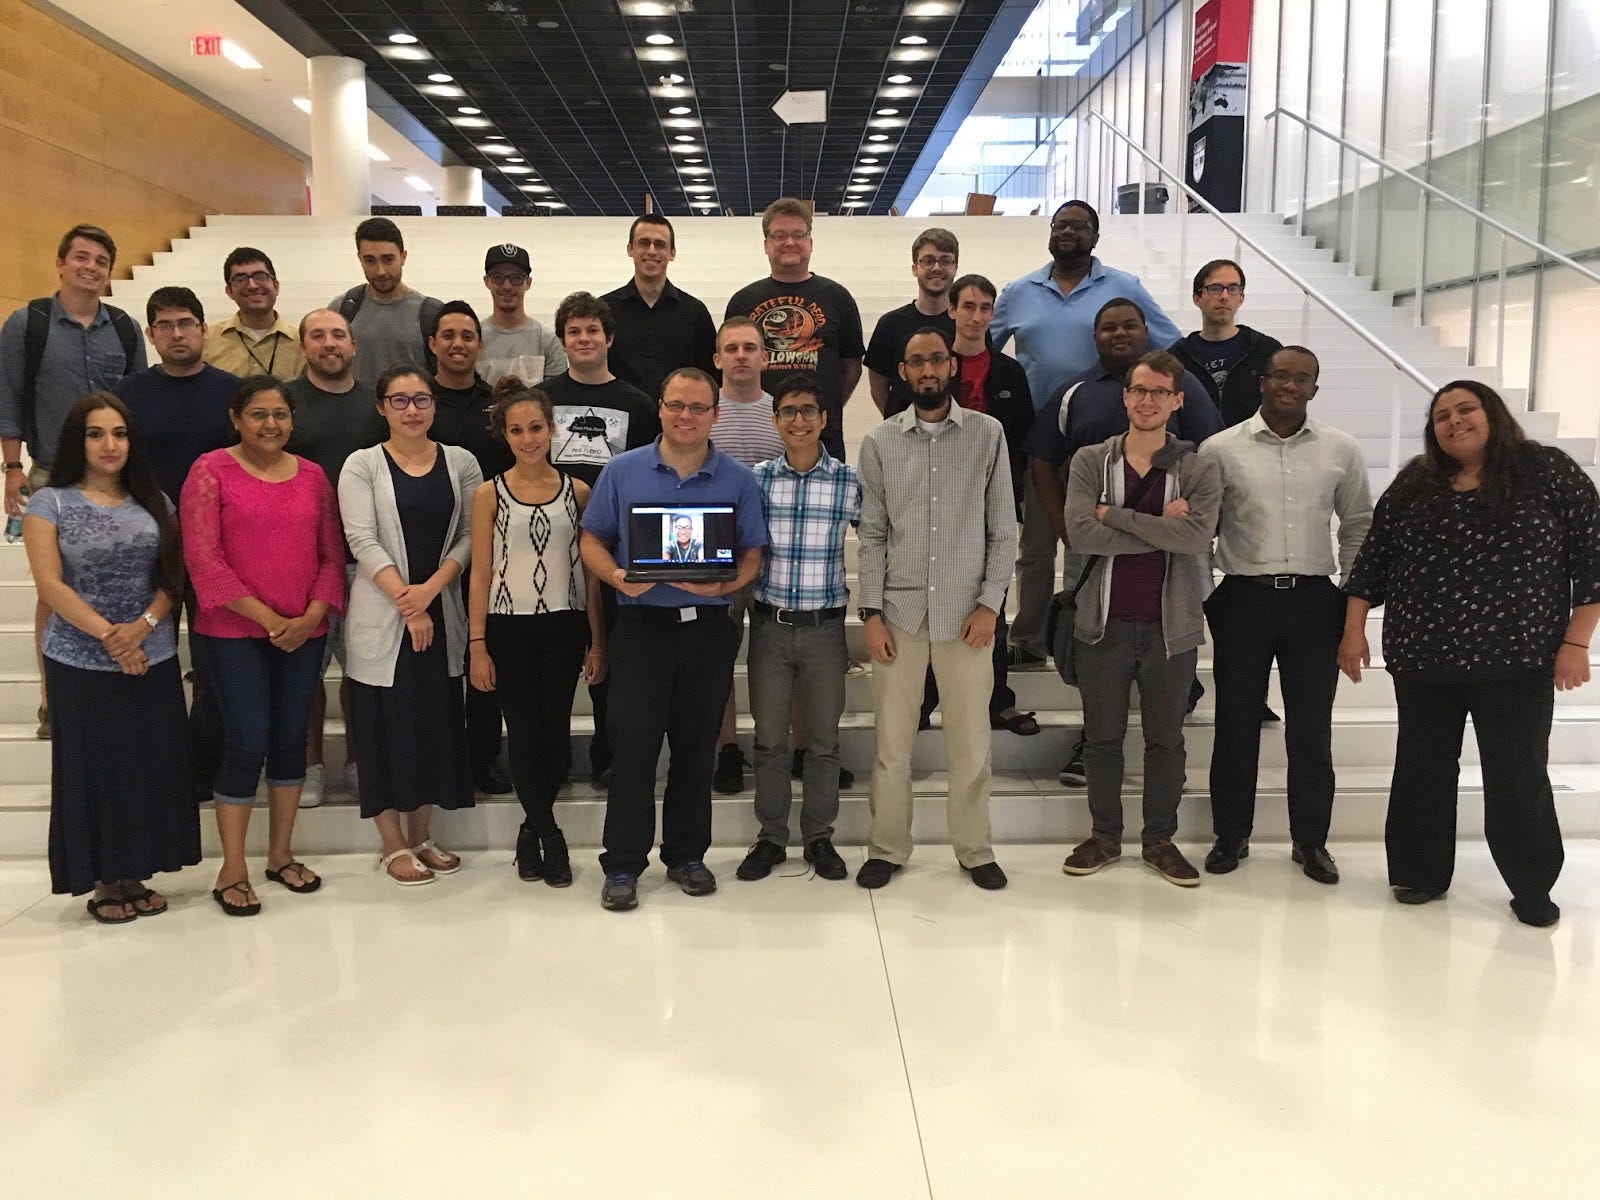
Ahmed’s first bootcamp in 2016
But his colleague’s students felt far from it. Their concerns were coming in non-stop. “You might be thinking that it’s just one classroom,” he points out. “But at that point it was 50% of our active classes. Imagine if it was 50% of 1000 classrooms”
It’s at this point he delivers one of the realities that people often forget about product-market fit in the early stages:
“You haven’t achieved product-market fit if you have a service that can’t scale. It’s not a ‘product’ until it has the potential to scale.”
Trilogy Education is a workforce accelerator that partners with universities to help companies bridge the digital skills gaps. The company was birthed from observing two macro trends that were playing out in edtech back in 2015, both of them spawning successful companies:
A rising cottage industry of coding bootcamps (e.g. General Assembly, Dev Bootcamp, Hack Reactor)
A growing acceptance of Online Program Management (OPM) and university partnerships (e.g. 2U, Keypath, Embanet)
Soon after this episode, Trilogy did find the ‘secret sauce’ to scaling their business. In three-and-a-half short years, they partnered with over 50 institutions and taught over 40,000 students. In 2019 they were acquired by 2U, the largest OPM, for $750m.
So, how did they go from having a service that didn’t scale to a product where thousands of students were saying things like: “It was probably one of the greatest and most empowering experiences of my life”?
The answer was in measurement. And magic.
Define the magic
“The starting point in any metrics conversation has to be in defining what matters,” says Ahmed.
“Great products deliver ‘magical’ experiences that far transcend the normal expected assumptions. The key question you need to consider is, at your very best, what makes your product truly magical?”
For Trilogy, he says, it boiled down to establishing three things:
A deep and sincere empathy for their students goals and struggles, company-wide
A high base-line for the teaching experience: understanding the makeup of an excellent teacher
A high base-line for the curriculum: one that was built to engage and paced to encourage students and reduce the cognitive load on the instructional teams
“Every staff member was taught to have an empathy-first mindset for students,” says Ahmed. “It wasn’t enough to simply teach students. We saw our role as creating a bridge between where students were in life to where they wanted to be. We felt the need to fully own the responsibility of creating this path. And to praise students for taking the leap.”
They also established a tight process for identifying which instructors would be truly phenomenal in the classroom. Those with a strong technical background, high EQ and compassion, strong communicators with high energy who had a history of voluntary service and were “humble beyond measure”.
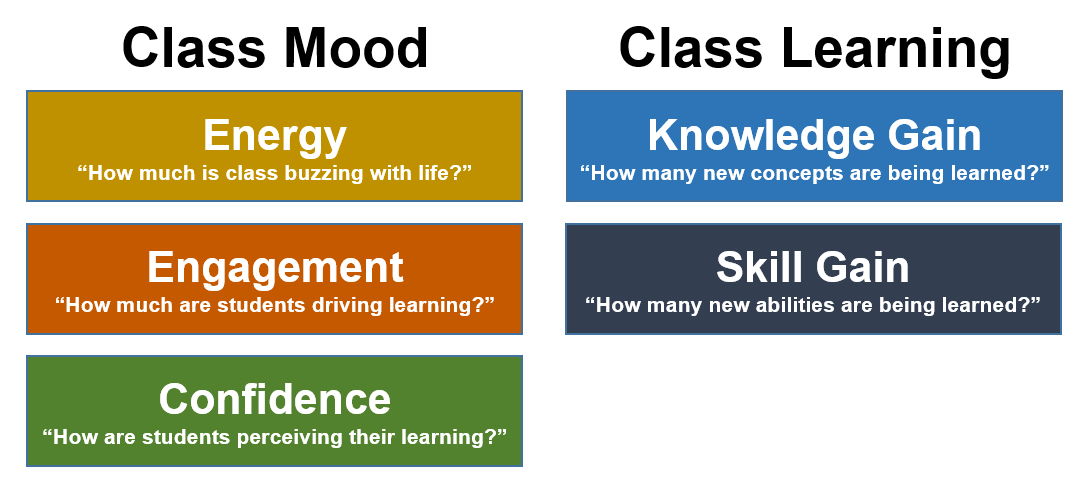
Finally, they created a curriculum with ‘pre-baked’ activities and speaking points that established a high degree of energy, engagement and confidence so that regardless of the instructor they knew the baseline would be positive. “We even scripted in the jokes”, remembers Ahmed. “We had jokes used in every classroom that would get laughs every time.” This was their ‘fail-proof’ curriculum.
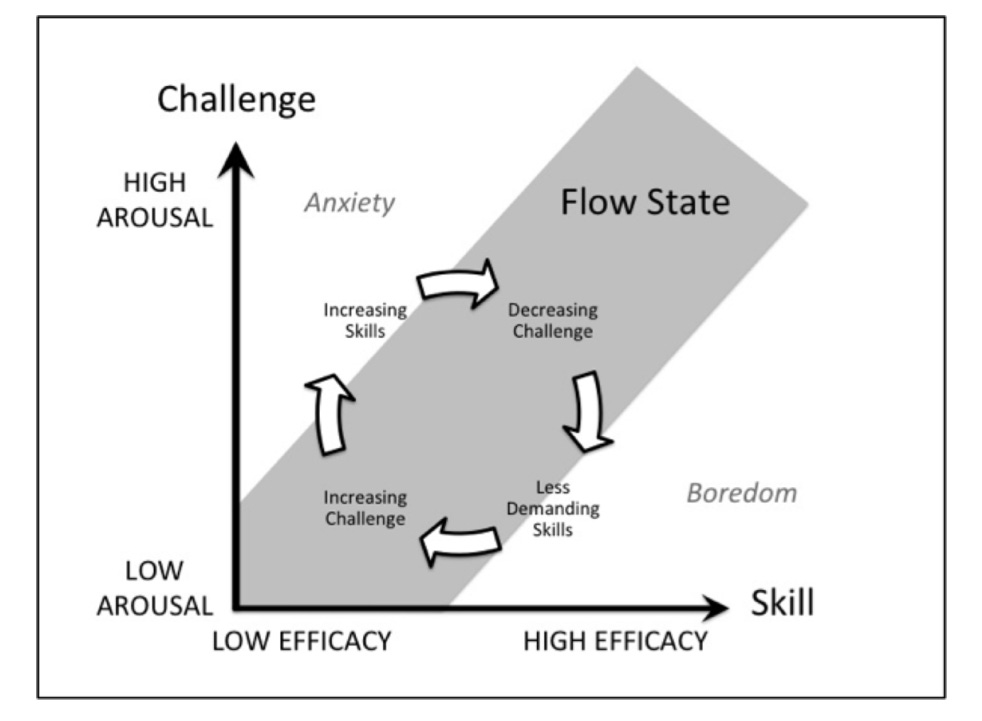
The curriculum established a pace that would keep students in a state of confidence-building without leading to boredom or disengagement.
“We defined the elements of the experience that need to be productised,” explains Ahmed. “We established the recipe for scalable success.” And once you have the magic defined, you can start to measure and track how well you are executing against that recipe.
Things to apply:
Define what makes the experience you’re delivering magical
Find ways that allow you to repeat it in a ‘fail proof’ way at scale
Relentless surveying
“Early on we realised that we could understand if we were creating our target experience by tripling down on performance and perception monitoring,” explains Ahmed. “We were working with adults and adults know if they are getting a good experience or a terrible experience.”
They created a set of KPIs that they expected to see at a class and student level based on student sentiment. “I got a lot of push back that sentiment was a bad predictor. But I think it’s underestimated in education. You are not going to learn if you’re not having a good experience. If you don’t feel supported, if your instructor’s not clear, it doesn’t matter what assessment methods you come up with: you will lose steam.”
They set about delivering simple surveys every week that asked students to give them a window into how they were feeling.
“Nothing was complicated, we just used Google Forms,” says Ahmed. “We mandated completion of these surveys and stuck to our original formula. We didn’t have fancy systems but we did the work which helped establish the practice inside the company. In two and a half years we had over 3 million data points.”
Things to apply:
Define a set of simple KPIs that map to your recipe
Find a way to systematically measure them regularly and consistently
Don’t over complicate it - simple tools are enough!
Responding to the data
So, what was the end result of all of this nauseating data collection work? “From our office in New York we could pinpoint how every class in our ecosystem was performing. We knew which students were unhappy - and why,” say Ahmed.
“Because we tracked it weekly and mandated it we could see the sentiment in individual classes and students and how it changed over time. So if we said we were going to make a change, we would know within two weeks if that change was constructive or not.”
This had lots of positive benefits. For example, they tracked pace. Because the curriculum was the same in all of their universities, they could look at the data and reliably see where students were struggling, knowing the data was statistically significant. “This meant that we could see we had a problem in week 3 and then direct our curriculum efforts to revise those specific pieces of content.”
Things to apply:
Use the data you collect to drive your team’s activity and identify interventions where you can make improvements
Ensure that you are collecting data regularly enough to be able to quickly identify whether changes are an improvement
The golden metric
They started to look for correlations that might enable them to predict the end of course Net Promoter Score (NPS) - their most important but lagging metric. Through this process they identified that the secret to student satisfaction was ‘feeling supported’. This became their ‘golden metric’.
“Because we knew from the data that a low support score was indicative of the end of course NPS, we could dial in on this metric,” says Ahmed. At the time it was a little over 6% and their goal was to bring it to under 5%.
They introduced supplemental video content, over 120 videos designed to help with self-guided learning. They created a centralised tutoring service to provide 1:1 and group support. And through these initiatives and others, they steadily brought the low support metric down to below 2% when they were acquired. “We didn’t know that this was possible - we thought that 5% would probably be the floor,” says Ahmed.
Ahmed says this is the simple formula for success:
Determine what matters - where’s the magic?
Measure it
Respond to the measurements
Repeat
“You need to have a point of view. It might change but you need to have that. And don’t allow the data to be ignored: you need to direct the organisation to respond to it.” he says. “It was this system that allowed us to scale rapidly within the very visible university context with very little blowback.”
Things to apply:
Look for correlations between your lagging ‘North star’ metric and tangible things that you can make improvements to more rapidly
Once you have identified something that is indicative, use this to target teams to rapidly introduce improvements and measure the impact
Key takeaways
Finding product-market fit means that your offering has the potential to scale. You don’t have product-market fit if your product will only achieve customer success one-time and under perfect conditions.
Achieving product-market fit means identifying the true elements that make your service or experience magical. Hone in on what makes it standout.
Once you know what makes your product ‘magical’, devise a system to track how well you are maintaining the magic. Be relentless and unapologetic about tracking the information. It’s the only means you have to know that your product is delivering on its original promise.
“If you are setting out to improve education and you want to know that you’re actually improving the status quo,” says Ahmed, “it’s the only way to give you the conviction that it’s actually happening.”